 Cape Town City Guide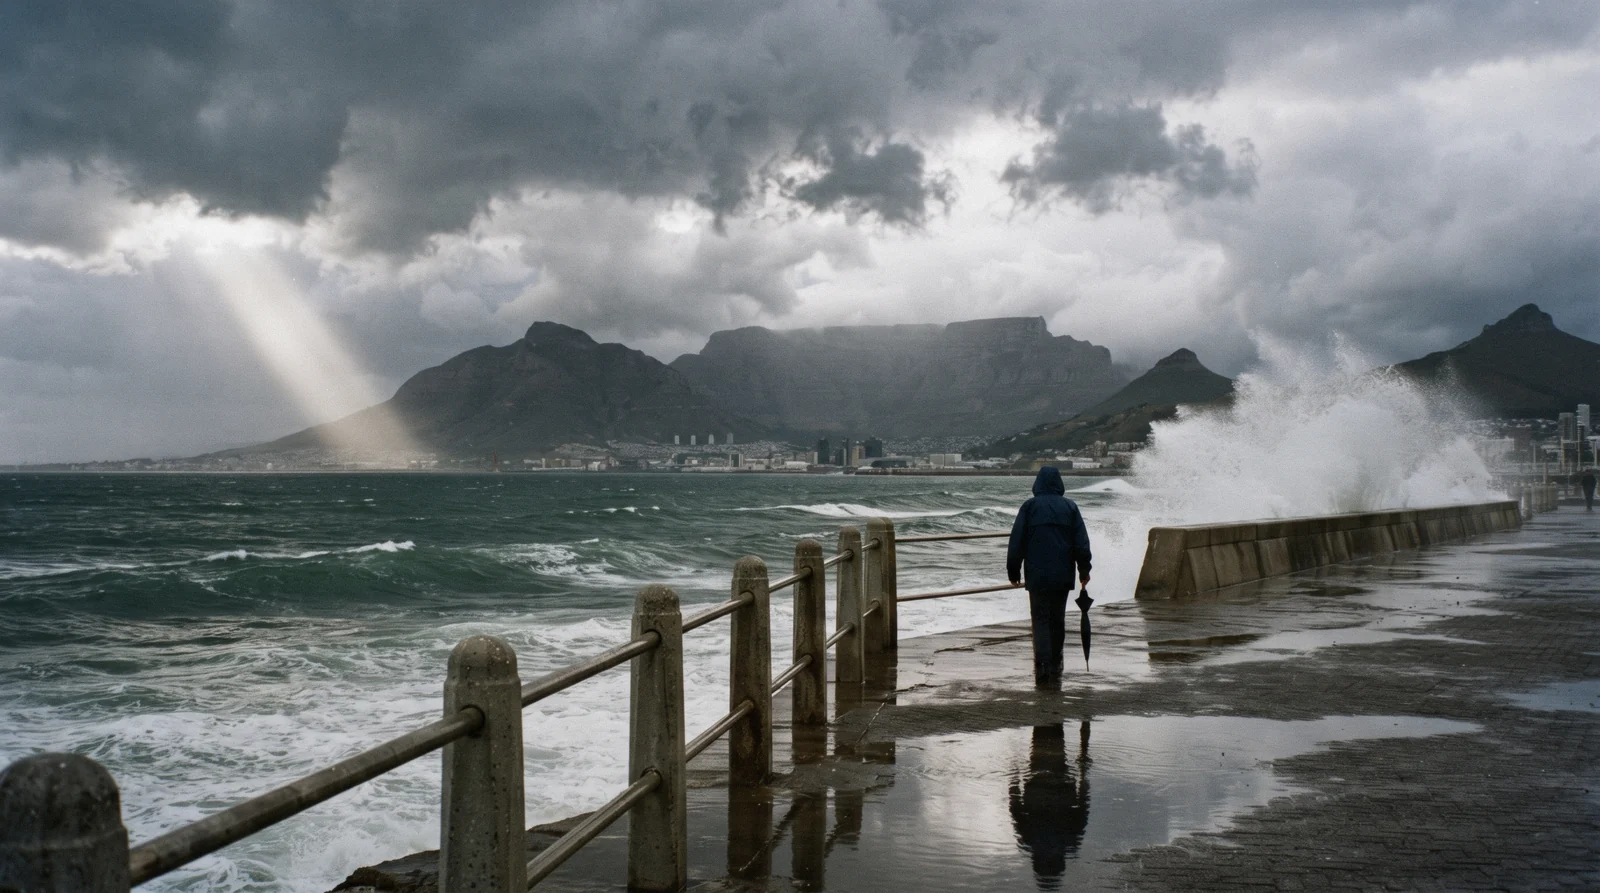
Cape Town Weather by Month
Cape Town weather by month is a story with two protagonists: winter rain and summer wind. This page prints the whole thirty-year record — the Open-Meteo ERA5 reanalysis for the city centre, 1995 to 2024, aggregated month by month — and then walks each month as a traveller meets it: what the cableway does, what the ferries do, what to pack. The record was computed in Q3 2026. If you are still choosing your dates rather than checking them, the decision-first version of this data is on the best time to visit page, and the whole trip assembles on the planning hub and the Cape Town city guide.
Quick answer The whole year in four lines, then every month in full
November to March is dry and warm (highs 22–26°C) but windy — the south-easter dominates more than half of summer days and blows hardest in December–January. June to August is the rainy season: 83–94 mm a month, highs around 16–17°C, cold fronts with clear days between them. April–May and September–October are the hinges, and often the best walking weather of the year. It never snows in the city, the coldest month averages lows of 9.4°C, and no month rules out a trip — each just changes what you book first.
Key takeaways
- Summer visitors: front-load Table Mountain — wind, not rain, is what closes it, and the online ticket's 7-day validity is your buffer.
- Winter visitors: the between-front days are superb, and the indoor bench is deep — Zeitz MOCAA fast-track entry at $17 is the wet-day anchor.
- July–November brings the whales: the Hermanus boat day belongs in any itinerary that touches those months.
- Whatever the month, the sea has two temperatures: False Bay warms to 18–21°C in summer while the Atlantic beaches stay cold — the beaches hub maps which is which.
The full twelve-month record
Thirty years of daily data, 1995–2024, reduced to monthly means: average high and low, rainfall, days with at least a millimetre of rain, mean daily maximum wind, and the share of days on which the dominant wind direction was south-easterly. Source: Open-Meteo ERA5 archive for 33.92 S, 18.42 E, computed in Q3 2026.
Read the last two columns together — they are the summer wind story in numbers. Rain days, not totals, are the better packing guide: June's 94 mm falls across ten days, not thirty.
| Month | High / low °C | High / low °F | Rain | Rain days | Max wind / SE days |
|---|---|---|---|---|---|
| January | 25.6 / 17.5 | 78 / 63 | 13.2 mm | 2.9 | 26.3 km/h · 56% |
| February | 25.9 / 17.7 | 79 / 64 | 11.2 mm | 2.5 | 25.2 km/h · 58% |
| March | 24.4 / 16.4 | 76 / 61 | 18.2 mm | 3.4 | 23.1 km/h · 55% |
| April | 22.1 / 14.2 | 72 / 58 | 34.1 mm | 4.6 | 20.2 km/h · 55% |
| May | 19.3 / 12.2 | 67 / 54 | 60.2 mm | 7.5 | 18.3 km/h · 39% |
| June | 17.1 / 10.3 | 63 / 51 | 94.1 mm | 10.1 | 19.7 km/h · 33% |
| July | 16.4 / 9.4 | 62 / 49 | 89.0 mm | 9.3 | 19.3 km/h · 37% |
| August | 16.5 / 9.7 | 62 / 50 | 82.5 mm | 10.2 | 20.4 km/h · 32% |
| September | 17.9 / 10.9 | 64 / 52 | 45.2 mm | 7.6 | 21.2 km/h · 41% |
| October | 20.6 / 12.9 | 69 / 55 | 29.6 mm | 5.3 | 23.1 km/h · 51% |
| November | 22.1 / 14.4 | 72 / 58 | 26.9 mm | 5.1 | 24.7 km/h · 51% |
| December | 24.2 / 16.4 | 76 / 61 | 18.1 mm | 3.9 | 25.4 km/h · 53% |
Three shapes jump out of the grid. The rain curve is a winter mountain: it climbs from March, peaks at June's 94.1 mm and 10.1 rain days, and collapses back to nearly nothing by December — the exact inverse of Europe's year. The temperature curve is gentle: only 9.5°C separates the warmest month's average high (February, 25.9°C) from the coolest (July, 16.4°C), which is ocean moderation doing its work.
And the wind curve peaks with the heat, not against it — mean daily maximum wind is highest in December–January at 25–26 km/h, with the south-easter dominant on over half of all days from October through March. Summer here is the windy season, and every month section below is written with that in mind.
December, January, February: high summer
The numbers: highs 24.2–25.9°C, lows 16.4–17.7°C, rain 11–18 mm a month across fewer than four rain days — the driest, most reliable sky of the year. Daylight is long, the evenings are warm, and this is the Cape Town of the photographs.
What the season closes is nothing; what it cancels, repeatedly, is wind-exposed plans. December and January carry the year's strongest mean winds, and on a big south-easter day the cableway stops, the Robben Island crossing gets lumpy or cancelled, and the Atlantic beaches turn into sand-blasting ranges while the False Bay coast stays workable. February eases: same heat, the wind's mean speed off its peak, and the sea at its warmest — the month the locals would keep for themselves.
What to pack: genuine sun kit (the UV is fierce and shade on the mountain is scarce), a windproof layer you will actually wear, and one warm thing for the evening south-easter. What to book: everything, early — this is the school-holiday block (the 2026 school year ends 9 December) and the booking peak the best-time page describes. The summer-specific treat is the early start: Lion's Head at sunrise exists as a guided fixture precisely because summer dawn is calm more often than summer noon.
March, April, May: the long descent, and the year's best walking
March is summer with better manners: 24.4°C average highs, 18 mm of rain, the south-easter still dominant on 55% of days but with its speeds declining. April drops to 22.1°C and 34 mm; May to 19.3°C and 60 mm, with the wind share falling to 39% as the first proper cold fronts arrive.
This is the stretch we would choose for the trails. The Platteklip Gorge climb in February is a heat exercise; in April it is a walk. Lion's Head at dawn, Kirstenbosch in its autumn colours (summer hours, 08:00–19:00, hold through March; winter hours begin in April), and Chapman's Peak Drive on a still afternoon — checked against its live status, since rockfall closures do not follow seasons — are all at their best. The Winelands harvest runs through this window too, which the day-trips page turns into itineraries.
May is the gamble month, and an honest one: 60 mm of rain means the first fronts are real, but seven rain days leave three weeks of usable weather, prices are falling, and the crowds are gone. Pack a proper rain shell from April onward and a warm mid-layer for May evenings, when the lows reach 12.2°C.
June, July, August: the wet season, without the myths
The record is blunt: June 94.1 mm across 10.1 rain days, July 89.0 across 9.3, August 82.5 across 10.2, with highs of 16–17°C and lows dipping to July's 9.4°C. It is the coolest, wettest, quietest stretch of the Cape Town year — and the myths about it run in both directions.
The myth that it rains all winter fails on the same numbers: ten rain days a month means two-thirds of winter days are dry, and the fronts that bring the rain pass in one to two days with washed, windless, spectacular weather behind them. The counter-myth — that winter is secretly the best season — fails on the fixtures: Cape Point in cloud is a car park, gates shorten (the point's gates run 07:00–17:00 April–September against 06:00–18:00 in summer, on the reserve's own page), the Kirstenbosch summer concerts stop, and beach days are off the menu.
What winter does hold: the whales arriving from June–July for the season that peaks in spring; storm-watching from the Sea Point Promenade; the museums at local pace — Zeitz MOCAA daily, the aquarium 365 days; and the year's lowest demand for beds. Note the operators' own winter rhythms: the 2026 cableway maintenance shutdown ran 27 July – 9 August, and the Oranjezicht market suspends its Wednesday evening session in June–July. Pack as for a British autumn — waterproof shell, warm layers, and one good pair of shoes that can get wet.
September, October, November: the year turns fast
September is the pivot: rain nearly halves from August (45.2 mm), highs recover to 17.9°C, and two seasons arrive at once — the West Coast flowers, which the national park prices into its own gate fee for August–September, and the whale peak at Hermanus, which runs strongest September–November on the town's own calendar. No other month stacks two windows like that, which is why September features so heavily on our day-trips page.
October dries to 29.6 mm and warms to 20.6°C, and the south-easter announces summer by returning to dominance on 51% of days. November is functionally early summer — 22.1°C, 26.9 mm — with one enormous advantage over December: the schools are still in and the holiday surge has not begun. If your dates are free but your budget is not, October–November is the value play the best-time verdicts point to.
Spring packing is the widest brief of the year: sun kit and a rain shell in the same bag, plus the wind layer that summer will demand. Spring booking is the narrowest: whale boats and flower-season weekends sell to a deadline nature sets — the whale trip and the flower-day tour are the two to fix first.
What the weather actually closes and cancels, month by no month at all
The cancellation layer of Cape Town runs on wind and swell, and it does not follow the calendar — which is why this page keeps repeating a structural rule instead of a seasonal one: book the weather-hostage fixtures early in the stay, whatever the month.
The Table Mountain cableway suspends operations for wind with no notice; its own ticket terms — valid 7 days from the selected date — are the official acknowledgment of how routine this is. The morning is statistically your friend (the south-easter builds through the day in summer), but only the day itself decides. The Robben Island ferries cancel for swell in winter fronts and big summer blows alike; the museum's channels announce it, and rebooking pressure lands on the next clear days, so an early-stay slot buys you a retry. Chapman's Peak Drive closes for rockfall after heavy rain — it was closed outright when we checked in Q3 2026 — and the only truth about it is the live status page. Boulders Beach and the False Bay coast, sheltered from the south-easter, are the standing plan B for a blown-out Atlantic day; the paragliding operators fly on the days the mountain says yes, not the days you booked.
None of this is a reason to under-plan. It is a reason to plan in the right order: fixtures with weather exposure first and flexible, indoor and lee-side options held in reserve. That ordering logic is the spine of the 3-day itinerary.
What this record can and cannot tell you
A note on method, because a weather page is only as honest as its limits. The figures on this page are the Open-Meteo ERA5 reanalysis — a gridded reconstruction of the historical atmosphere — sampled at the city centre and averaged over 1995–2024. Thirty-year monthly means are excellent at answering 'what is February like' and useless at answering 'what will 14 February be like': individual summers throw 35°C spikes and individual winters throw week-long front trains, and neither shows in a mean. Treat the table as odds, not promises.
Two further limits we flag rather than hide. The centre-point sample understates the suburbs' spread — the mountain chain manufactures real differences over small distances, which is why the two-coasts section exists — and rain days at the ≥1 mm threshold count drizzle and deluge as the same tick, so June's 10.1 rain days overstate how many days are actually lost. And where no defensible number exists — Atlantic beach water temperatures, monthly crowd counts, an official definition of the 'Cape Doctor' — this page prints the mechanism or nothing, because a made-up figure with a decimal point is worse than an honest blank.
What you can bank on: the shape of the year. Winter-wet, summer-windy, a 9.5°C spread between the warmest and coolest months, and the fixtures — cableway, ferries, Chapman's Peak — reacting to the day, not the month. Figures re-checked quarterly; this cycle in Q3 2026.
How cold does it get — and does it ever snow?
The city's coldest month, July, averages lows of 9.4°C and highs of 16.4°C. Frost in the city bowl is not part of the thirty-year monthly record's story, and snow does not fall in the city itself: when Western Cape cold fronts are strong enough, snow lands on the high inland mountains — a white cap you might see on distant peaks from a winter viewpoint — not on Cape Town's streets. Table Mountain's summit sits around a kilometre up and gets hail and rare sleety moments in hard fronts, but a snow-day in Cape Town is a news event, not a season.
The cold that actually affects visitors is milder and sneakier: unheated buildings. Much of the city's accommodation stock is built for summer, and a July evening at 10°C outside can feel colder in a poorly insulated apartment than the number suggests — worth a question to your accommodation before a winter booking, and worth the warm layer in the bag. The where-to-stay comparison flags this among its winter notes.
At the other end, heat is rarely dangerous by global standards — February's 25.9°C mean high is a Mediterranean number — but the sun is not: the UV load on a clear summer day punishes casual exposure, and the mountain trails have almost no shade. The safety page carries SANParks' own hiking advisories; 'start early' is heat advice as much as security advice.
One city, two coasts: the weather split the table hides
The monthly means above describe the city centre; the coastline complicates them in a way that decides beach days. Cape Town fronts two bodies of water with different physics, and the difference is documented rather than folkloric: an Ocean Science study of False Bay's coastal gradients records shelf temperatures rising gradually from 18 to 21°C over the summer on the Muizenberg–Kalk Bay side, while the same paper describes the mechanism that keeps the Atlantic beaches cold — the summer south-easter drives upwelling on that coast, pulling deep cold water to the surface at Clifton and Camps Bay precisely when the air is hottest.
The wind splits the coasts too. A big south-easter day scours the Atlantic beaches with blown sand while the False Bay shore, in the mountain chain's lee, stays workable; the reverse holds in winter, when north-westerly fronts batter the Atlantic side first. The practical translation: in summer, a blown-out morning at Camps Bay is not a cancelled beach day but a relocated one, and the beaches hub maps the swap options coast by coast.
No official temperature series exists for the Atlantic beaches themselves — the ~8–16°C figures that circulate are secondary at best — so we print the mechanism and the False Bay numbers and leave the rest blank. The rule of thumb that survives the missing data: swim False Bay, photograph the Atlantic.
Reading a Cape Town forecast like a local
Thirty-year means buy you the right month; the day-by-day trip still runs on forecasts, and three reading habits extract far more from them here than at home.
First, read wind speed before rain probability. From October to March the number that cancels plans is the south-easter's strength: a 30 km/h+ forecast afternoon is a cableway risk and an Atlantic-beach writeoff regardless of the cloudless icon next to it, which is why the cancellations section puts the mountain on your first calm morning. Second, in winter, read the front's timing rather than the day's summary — a '60% rain' Tuesday often means a front crossing before noon and a rinsed, still, brilliant afternoon behind it, and the difference between those two Tuesdays is a salvaged Kirstenbosch visit. Third, treat the mountain as its own weather system: the tablecloth cloud can sit on the summit while the city grills in sunshine, and the cableway's own live page — not the city forecast — is the only source that answers 'is it running right now'.
Our reading, labelled as such: the checking rhythm that works is once the evening before (shape the day) and once at breakfast (commit to it), with the flexible-slot logic of the 3-day itinerary absorbing whatever the second check breaks.
Bookings that ride the weather well
Four cards chosen for their weather logic: the indoor anchor, the whale season's main event, the dawn hike that beats the wind, and the flight that only happens on the right day. Prices and ratings are the platform's own figures, checked in Q3 2026.
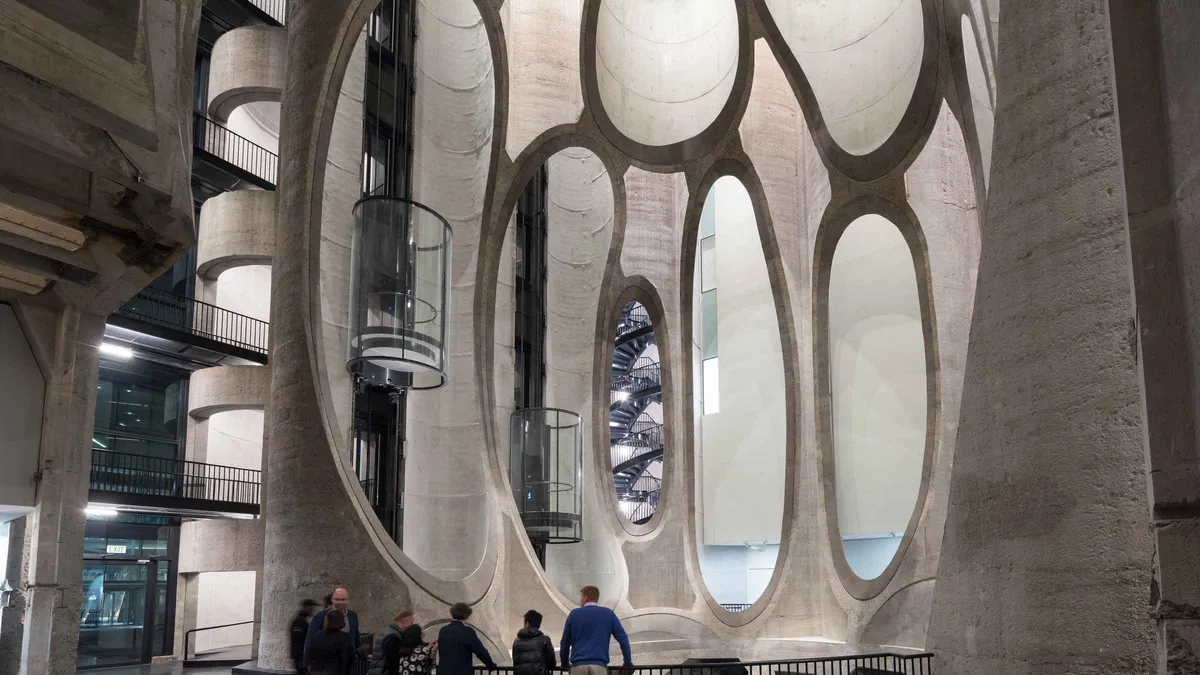 from $17
Museum of Contemporary African Art: Fast-Track Zeitz MOCAA
Fast-track ticket to Africa's biggest contemporary-art museum in the converted grain silo, flexible on date until scanned. African citizens enter free on Wednesdays 10:00-13:00 — this ticket is for everyone else.
Check Availability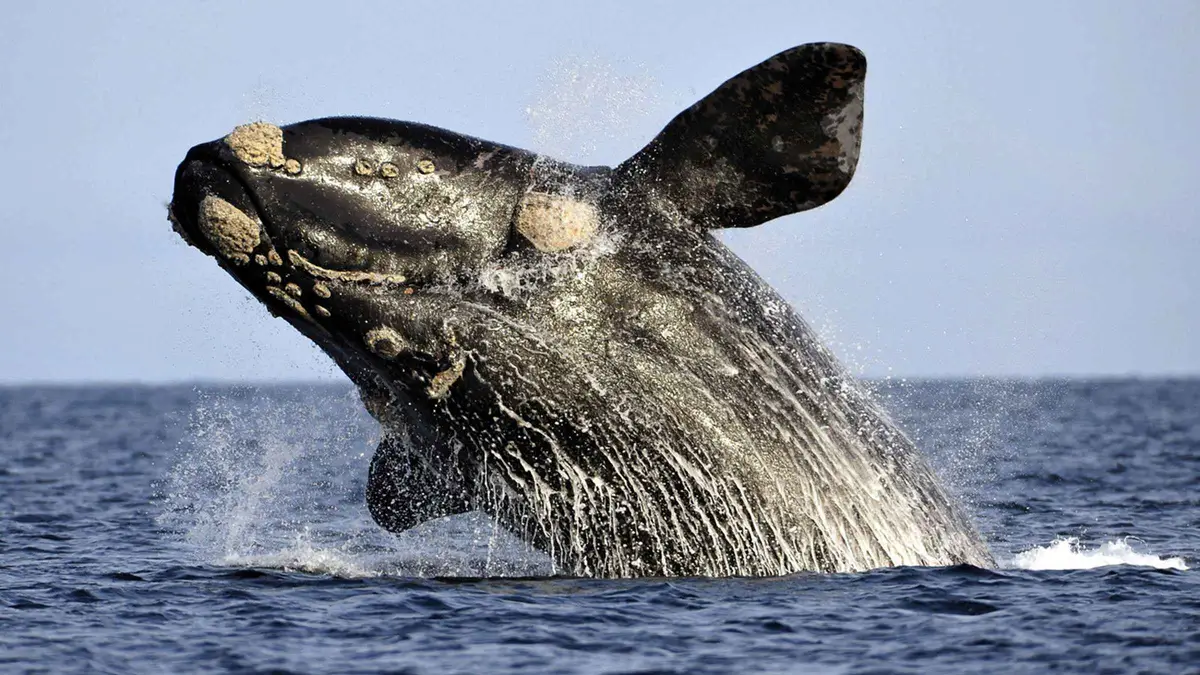 from $221.16
From Cape Town: Hermanus Whale Watching Boat Trip
Boat-based whale watching out of the Hermanus coast with Cape Town hotel transfers, drinks and snacks in the price — you're on the water, not the cliff path. Season peaks June-November.
Check Availability from $44.86
Cape Town: Lion’s Head Sunrise/Sunset hike or Table Mountain
Sunrise or sunset on Lion's Head in a small group with head torches and first-aid kit, 3-3.5 hours. Same operator and format as the Table Mountain hike — pick the peak, not the price.
Check Availability from $105.91
Cape Town: Tandem Paragliding Adventure
Tandem paraglide off Signal Hill with a certified instructor, equipment and take-off transport included; the flight itself lasts 5-20 minutes on the day's thermals. GoPro footage costs extra.
Check AvailabilityPrices, ratings and details are the platform's own, checked in Q3 2026; dollar figures are the listed prices — the platform bills in your account's currency.
Where to go next
Choose the month, not just read it
The same record turned into a decision — seasons chart, crowd logic, cheapest windows: the best time to visit Cape Town.
The decision layerThe fixed dates in the year
The Cycle Tour, the marathon weekend and the concert season, each with its officially published date or an honest 'not yet announced': the events calendar.
Dated events onlyA wet-day plan that already exists
Museums, the aquarium and the food halls strung into indoor days: things to do in Cape Town. Or start at the planning hub.
Front-passing weatherCape Town weather: questions
What is the rainy season in Cape Town?
Winter — June to August, with June the wettest month at 94.1 mm across 10.1 rain days in the thirty-year record. Rain arrives as cold fronts with clear days between them, not as weeks of drizzle. The full pattern is in the twelve-month table and the winter section.
What is the coldest it gets in Cape Town?
July is the coolest month, averaging lows of 9.4°C and highs of 16.4°C. The practical cold problem is unheated summer-built accommodation rather than the outdoor air — see how cold does it get.
Does Cape Town get snow?
Not in the city. Strong winter fronts put snow on the high inland mountains, visible as distant white caps, and the summit of Table Mountain can catch hail — but snow on Cape Town's streets is a rarity of headline proportions. The detail is in the snow section.
Which months are windiest in Cape Town?
December and January, when mean daily maximum wind runs 25–26 km/h and the south-easter is the dominant direction on more than half of days — summer, counterintuitively, is the windy season. What that closes and cancels is in the cancellations section.
What should I pack for Cape Town?
Summer: serious sun protection, a windproof layer and one warm piece for south-easter evenings. Winter: a waterproof shell and warm layers, British-autumn style. Spring and autumn: both bags at once. Each season's specifics are in its own section, starting with high summer.
Does the weather cancel the cableway often?
Often enough that the cableway's own ticket is valid for 7 days from the selected date — the official buffer for wind closures, which happen without notice in any month. Ride on your first clear morning; the mechanics are in the cancellations section and on the cableway tickets page.
Cape Town Weather on Video
Three clips for calibration: a practical weather explainer, and two news reports showing what a real winter front and a real heat spell look like here.
Weather Cape Town — 7 Things You Need to Know in Less Than 5 Minutes
A compact explainer of the inverted seasons and the summer wind this page quantifies.
Video: The BOLD TravellerTwo more cold fronts for Western Cape: South African Weather Service
A winter front as the national broadcaster covers it — the shape of the wet season in practice.
Video: SABC NewsWestern Cape braces for heatwave
The other extreme: what a summer heat spell means on the ground.
Video: SABC NewsVideos load from YouTube only when you press play.
Reviewed Q3 2026 (July–September 2026); next review Q4 2026. Prices, hours and terms are set by the venue or operator and confirmed at checkout.
We may earn a commission if you book through one of our links, at no extra cost to you. Full affiliate disclosure